
 What is the Asset Coverage Ratio?
Definition: The asset coverage ratio is a measure that tells stakeholders whether a company can cover all its debts using tangible assets or not. This is a crucial financial metric especially to potential investors in a company.
Simply, the value enables investors to predict the sustainability of the company going forward.
Indeed, the ratio focuses on tangible assets because they are more liquid compared to intangible assets. This means a company can easily convert tangible assets into cash as opposed to intangible assets. In another sense, financial analysts view the asset coverage ratio as a representation of a company’s solvency. Besides investors, lenders, regulatory authorities, and lenders find this financial metric crucial. For example, a lender considers the asset coverage ratio before determining the credit rating of a company. This helps in pricing loans to the company.
Different ratios tell different stories in terms of the solvency of a company. In the first place, an asset recovery ratio above 1 indicates that the company can pay its total debt by liquidating its tangible assets. Also, to pay off the total debt, the company will remain with some assets.
Secondly, an asset coverage ratio below 1 indicates that the company is incapable of paying off its total debt through asset liquidation. After liquidating all its tangible assets, such a company will require external help to cover the total debt. Thirdly, an asset coverage ratio equal to one indicates that the company can pay its total debt through asset liquidation but it will remain without any asset after that.
Asset Coverage Ratio Formula
The asset coverage ratio formula is calculated like this:
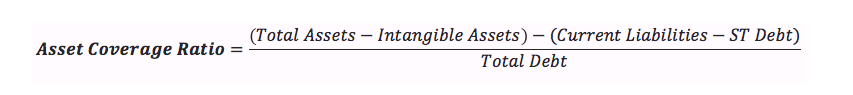
The asset coverage ratio focuses on three components of a company. Firstly, the ratio comprises of tangible assets. Tangible assets entail the property under a company’s ownership that has a physical form. This means one can touch them. Also, this kind of assets can be depreciated. Subtracting all intangible assets (assets that lack a physical form i.e. patents) from the total assets of a company leaves tangible assets as the result.
The second component of the ratio is liabilities. However, the measurement focuses only on current liabilities. This is because such liabilities require a business to maintain a high level of liquidity. After all, they are due within just a year. While considering current liabilities, one must exclude short-term debt.
This is because current liabilities include financial obligations that do not attract interest. Besides, short-term debt is already taken care of by being included in the total debt component of the asset coverage ratio. Lastly, total debt makes up the third and major component of the ratio. This includes both short-term and long-term debt.
Asset Coverage Ratio Example
Once you grasp the concept, using the formula is easy. To comprehend better, consider the following example:
During the year 2017, Company Theta reported the following information in its balance.
Balance Sheet for Company Theta for the FY2017
| Description | FY2017 ($) |
| Total Assets | 3,000,000 |
| Intangible Assets | 400,000 |
| Current Liabilities | 350,000 |
| Short-Term Portion of Long-Term Debt | 125,000 |
| Total Debt | 1,500,000 |
An analyst consulting for a group of investors has been tasked with determining the solvency of the company.
Step 1: Substitute the values in the formula.

Step 2: Computations
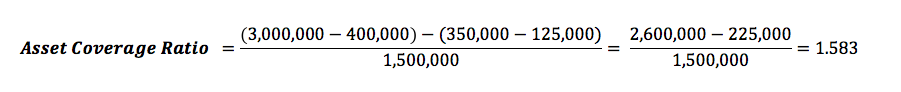
From the computations, the Asset Coverage Ratio of Company Theta as at December 2017 was 1.583.
Asset Coverage Ratio Analysis
Assume that in the following year (FY2018), the asset coverage ratio for the company was 1.12, and then 1.23 as at December 2019. Clearly, the values show that Company Theta’s solvency has not been stable in the last three years. However, this does not imply that the company suddenly began to mismanage its finances.
Without ruling financial mismanagement out, the wobble in the asset coverage ratio could indicate that the company carried out massive investments in fixed assets during the FY2018. In the following financial year, the company paid off significant long-term debt hence lowering the total debt.
Contents