
 The internal rate of return (IRR) is a financial ratio that measures the total amount of cash an investment will generate taking in consideration the initial investment as well as the discount rate.
Whether it is about putting money in a time deposit, a bond or stock market, what is the one most important factor you look at while making an investment? For most cases, it has to be the return (or potential return) that the investment can generate. Simply put, this return is also called Internal Rate of Return or IRR. We would select the investment opportunity which can generate the highest IRR for us.
Similar to the situation described above, even companies have to make several investment decisions on a regular basis. Suppose Company X might have 3 different business proposals (for example, build a power plant, expand an existing facility or keep the money in the bank). If we lived in the mystical world of Harry Potter than the project manager might simply wave a wand and make a large stash of money appear out of thin air and invest in all three options!
Unfortunately, companies in the real world are characterized by ‘resource constraints’ (i.e. limited money, manpower and time – MBAs like to use the word ‘Capital’). Hence the manager has to decide on the best of the three investment options available to the company. There are several financial measures (such as NPV, IRR, Payback period etc.) that the manager can consider but today we are going to describe IRR in more detail.
We will also briefly introduce the concept of NPV (Net Present Value) because it is a closely related concept.
Internal Rate of Return Formula
The internal rate of return formula is calculated by subtracting the initial cash investment from the sum of all future cash flow of the investment after a discount rate is applied.
The IRR equation is expressed like this:
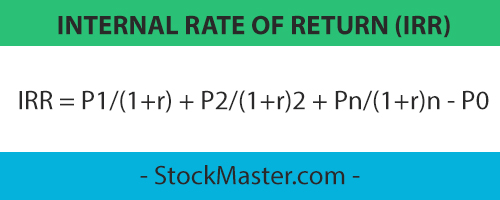
IRR Formula Components
The three components of the IRR formula are Po, Pn, and r where:
Po = the initial cash investment
Pn = cash flow from the project at the end of period n
r = discount rate, which is usually the cost of raising capital for the project
The above formula might seem to be complicated but if you look at it carefully it is relatively straightforward and is designed to align with human understanding.
For example, if I give you $100 today or $100 1 year from now, which one will you prefer (everything else being equal)? Surely, you would take $100 today because in theory you can investment this money and earn interest on it for one additional year.
This concept is called ‘time value of money’. So in the above equation if you are going to receive Cash P1 after the end of period 1 than to understand how much it is worth today you have discounted it back by 1 Period (and extend the logic for n periods).
NPV is one of the most commonly used methods to gauge the attractiveness of a project (more on that here). However, it is also required to understand the concept of IRR.
IRR is the discount rate r which makes NPV zero
In other words, at IRR the project will just break even (cash outflow = cash inflow). Considering IRR on a standalone basis is not very meaningful. It needs to be looked at from the prism of ‘expected rate of return’ (company’s internal estimate of how much return a project should generate) or ‘cost of capital’ (how much a company needs to pay its investors).
If IRR is higher than either the expected return or cost of capital than the project can be considered for investment.
Further, IRR should be compared to the NPV of the project. NPV gives us the magnitude of cash expected to be generated from an investment.
Internal Rate of Return Example
Let us consider Company X which has 3 projects under deliberation (Project A, Project B, and Project C). It has an expected rate of return of 50%. In the table below we put out the expected cash flow pattern for 3 years and calculate the IRR and NPV for each project. These calculations can be easily performed using a financial calculator or a simple spreadsheet.
| Project A ($) | Year 1 | Year 2 | Year 3 | IRR | NPV |
| Cash flow | -10 | 10 | 15 | 82% | $2.2 |
| Project B ($) | Year 1 | Year 2 | Year 3 | IRR | NPV |
| Cash flow | -500 | 500 | 600 | 70% | $66.7 |
| Project C ($) | Year 1 | Year 2 | Year 3 | IRR | NPV |
| Cash flow | -200 | -200 | 410 | 2% | ($100.7) |
Purely based on IRR we can see that both projects A and B have IRR more than 50% (expected rate of return) and we can invest in any one of them. Since Project A has higher IRR the company may choose to invest in it. However, if we consider NPV it tells us that although Project B has lower IRR compared to Project A, it has much higher NPV. In other words, Project B will have significantly more value to the shareholder wealth. Hence the company may choose to go ahead with Project B.
The above example is also highlighting an important shortcoming of the IRR method. IRR doesn’t highlight the size of the project. For example, Project A has much smaller cash flow pattern compared to Project B yet it is ranked higher on IRR basis. It might be more beneficial for a company to undertake a bigger project and add more value to the shareholders.
Project C highlights yet another issue with the IRR method. The method suggests a positive return from this project. That is investors can earn some additional benefit by investing in this project. But if you consider the NPV than we can see that Project C is actually destroying shareholder wealth. The company should never invest in project C.
Internal Rate of Return Analysis
Now that we have looked at the IRR method in detail let’s enumerate its advantages and disadvantages. Please note that each point below is mentioned briefly but in reality, they are a matter of detailed study and are projects in themselves!
Advantages
- Very intuitive – Everyone understands and loves the concept of returns
- Can be used to compare projects of different size
Disadvantages
- Impacted by timing of cash flow & difficult to measure if the cash flow pattern is not uniform
- Can’t be used to compare projects with significant difference in duration and cost of capital
- Doesn’t measure the absolute size of the investment
Contents